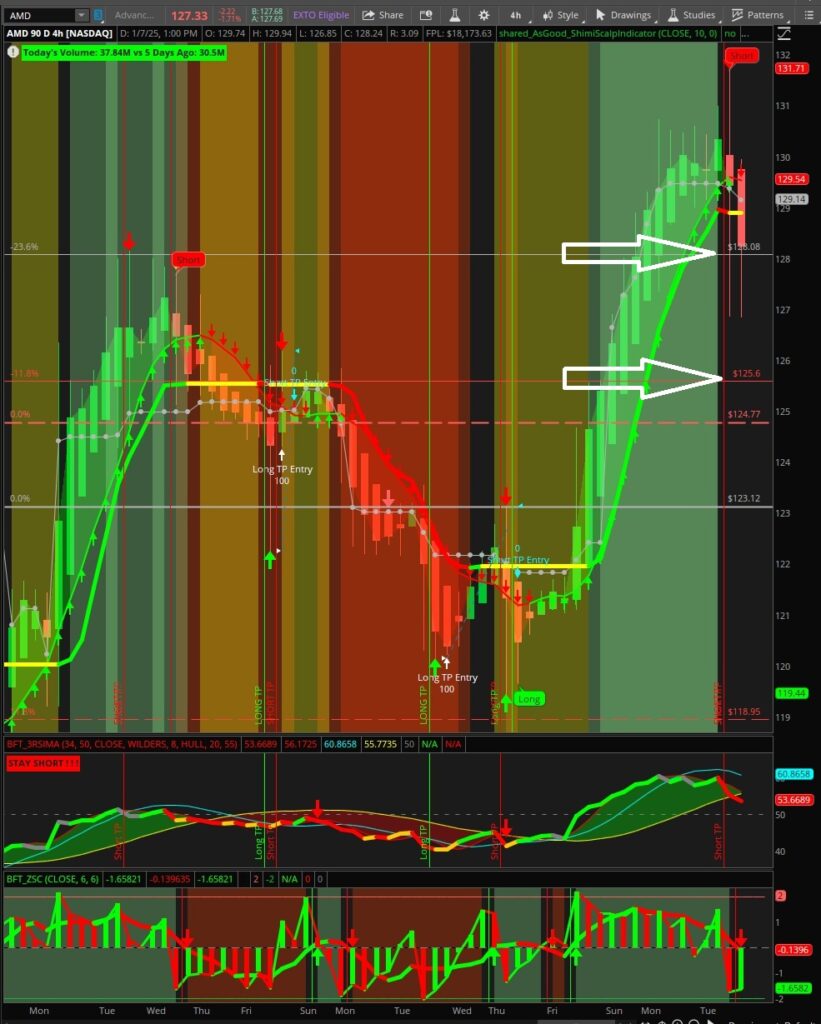
In the dynamic world of trading, understanding market movements and predicting potential price reversals is crucial for success. One of the most popular tools for this is Fibonacci levels. Traders and investors, including large institutions, often rely on these levels to make informed decisions. This blog will delve into why Fibonacci levels are important, how they are used in trading, and provide real-world examples of their application.
What are Fibonacci Levels?
Fibonacci levels are derived from the Fibonacci sequence, a series of numbers where each number is the sum of the two preceding ones (e.g., 0, 1, 1, 2, 3, 5, 8, 13, 21, etc.). In trading, key Fibonacci ratios—23.6%, 38.2%, 50%, 61.8%, and 100%—are used to identify potential retracement and extension levels in the price of a financial asset.
Importance of Fibonacci Levels in Trading
1. Predictive Nature: Fibonacci retracement levels help traders anticipate potential areas where the price might reverse during a pullback in a trend. For instance, after a significant upward move, a stock might retrace to the 38.2% or 61.8% level before continuing its ascent.
2. Market Psychology: Since many traders watch these levels, they often become self-fulfilling prophecies. When a large number of traders place orders around these levels, they naturally become areas of support or resistance.
3. Risk Management: Fibonacci levels are instrumental in setting stop-loss orders and identifying profit targets. For example, a trader might place a stop-loss just below a key Fibonacci retracement level to minimize potential losses if the market moves against them.
4. Versatility Across Timeframes: Fibonacci analysis can be applied to any timeframe, from minute-by-minute charts for day traders to monthly charts for long-term investors. This versatility makes it a valuable tool for all types of traders.

Examples of Fibonacci Levels in Action
Example 1: Stock Market Let’s consider a stock that has risen from $100 to $150. After this uptrend, the stock begins to pull back. Traders might look for potential support levels at the Fibonacci retracement levels of 23.6% ($138.2), 38.2% ($130.9), or 61.8% ($119.1). If the stock finds support at the 61.8% level and resumes its upward trend, this confirms the significance of this retracement level.
Example 2: Forex Market In the Forex market, suppose the EUR/USD pair has been trending upward, moving from 1.1000 to 1.1500. If the pair starts to retrace, traders might look for support at the 38.2% level (around 1.1290) or the 50% level (around 1.1250). When the price bounces off these levels and continues upward, traders see this as a confirmation of the trend.
Example 3: Cryptocurrency In the volatile cryptocurrency market, suppose Bitcoin surges from $40,000 to $60,000. During a correction, traders might watch the 50% retracement level at $50,000. If Bitcoin finds support at this level and starts climbing again, it provides a strong signal that the bullish trend may continue.
Do Big Institutions Use Fibonacci Levels?
Yes, large financial institutions often incorporate Fibonacci levels into their trading strategies. While they have access to sophisticated tools and algorithms, Fibonacci levels remain a staple in technical analysis due to their simplicity and effectiveness. Institutions use these levels alongside other indicators to refine their trading strategies and make informed decisions.
Conclusion
Fibonacci levels are a powerful tool for traders of all levels. By understanding and applying these levels, traders can better predict market movements, manage risks, and make more informed trading decisions. Whether you are trading stocks, forex, or cryptocurrencies, incorporating Fibonacci analysis into your strategy can help unlock your market potential.
Takeaway
If you are new to Fibonacci trading, start by applying these levels to your favorite financial assets and observe how the market reacts. For seasoned traders, consider refining your strategies by combining Fibonacci levels with other technical indicators to enhance your trading performance.

